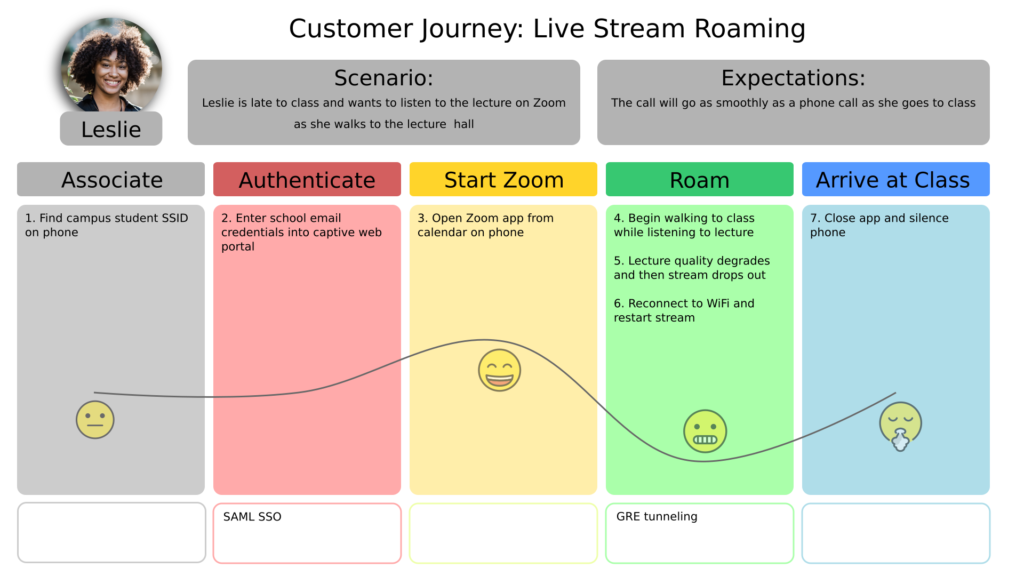
This was developed as a sample (no client) using InkScape on Ubuntu Linux 22.04. Woman image credit: Mizuno K on Pexels.com. Emoji credit: openmoji.org.
This was developed as a sample (no client) using InkScape on Ubuntu Linux 22.04. Woman image credit: Mizuno K on Pexels.com. Emoji credit: openmoji.org.
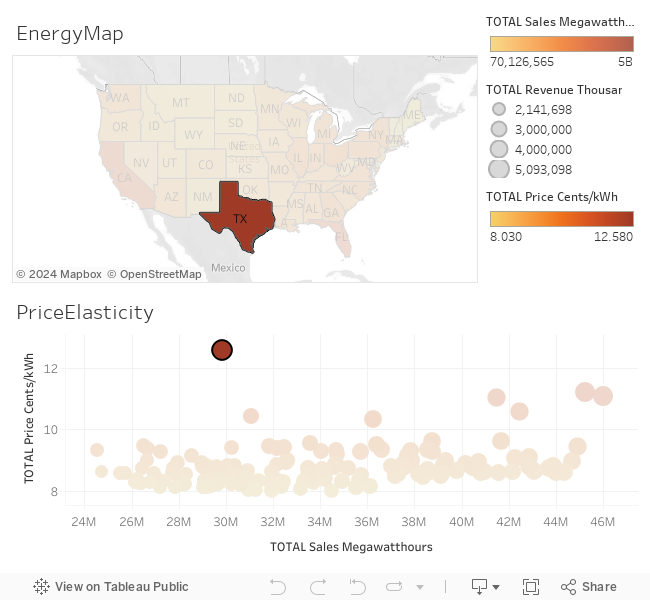
This is an experiment in using Tableau for visualization. Data is from the US EIA.
Analytics dashboards are interfaces for viewing, interpreting, and exploring summaries of complex data. Dashboards may be used to report on the status of complex systems such as those found in large scale business, scientific, or logistical operations. Dashboards often combine multiple charts in a single view to be printed or viewed on a screen. Charts are named patterns for ways to create graphics to represent data. Different types of charts (line, bar, pie charts), and components of charts (title, legend, axis) are easy to create using software packages. Certain of these ways of representing data are widely useful in a variety of applications, so we call these “patterns”. However, there are many commonly used charts and chart components that are poor at accomplishing their intended purpose, or are often abused by using them for the wrong purpose. We call these “anti-patterns”. What follows are some examples of anti-patterns for analytics dashboards, and some suggested alternatives.
Please note, though, that all of these patterns and anti-patterns have situations where their usage is merited. These are simply some cases where there are some other alternatives that should be considered.
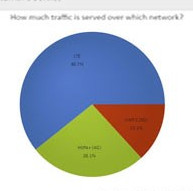
Pie charts are some of the most commonly used data visualizations in business settings. However, this type of visualization is almost always suboptimal for a given task, or abused to the extent that it should
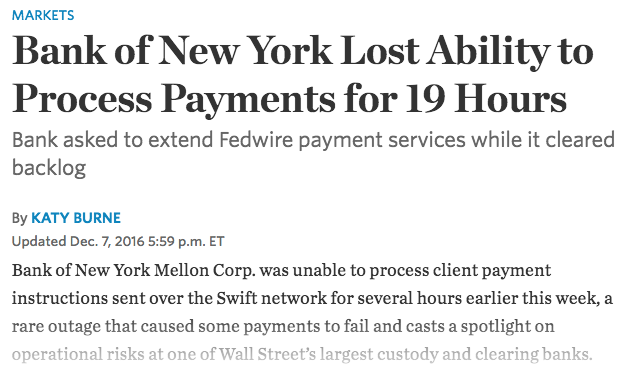
IT infrastructure for financial institutions is becoming increasingly complex. Modern banking infrastructure combines mainframe applications, monolithic applications based on Service Oriented Architecture, relational databases, and big data platforms. This complexity has led to “brittleness”. Under certain conditions, a failure in a subsystem of the infrastructure can lead to catastrophic failure of an entire business function such as clearing and settlement (see below).
In addition to lacking resiliency, these systems lack robustness. Robustness in the face of resiliency means that services degrade gracefully as subsystems become unavailable in a manner that is consistent with business needs. Finally, disaster recovery mechanisms must be put in place that allow full capabilities to be restored in a timely manner after subsystems have failed.
The key question is: What best practices can be employed to ensure greater resiliency and robustness for IT infrastructure?
Financial institutions today use a combination of mainframes, monolithic applications, relational databases, microservices, and big data platforms. Communication between these subsystems is done across a variety of different channels. These include mainframe communication fabrics, enterprise service buses, lightweight message queues, and integration middleware. Each of these have different ways of storing and transmitting state changes, transforming data, maintaining consistency, and queuing transactions and messages.
This makes it difficult to debug and restore systems when there are problems. There may be no central repository for debug information. Subsystems may have unknown dependencies. Messages and transactions lost in-flight may not be recoverable in the event of system failure.
Banks and other institutions employ a wide range of infrastructure, some of it legacy in nature. Mainframes, in particular, have maintained backwards compatibility from generation to generation. This implies that some code may still be used in production after having been written fifty years ago! This code may be poorly documented, as well as difficult and expensive to re-engineer.
Many different applications and services may all be storing and retrieving state information from a single centralized relational database. This can cause a single point of failure and coupling between subsystems. The use of centralized databases are often mandated to reduce licensing and administration costs. However, in the era of FoSS (free and open source software), this restriction is no longer necessary.
The SOA, or Service-Oriented Architecture, decomposes enterprise software into business processes, services, service components, and operational systems. SOA architecture was designed to maximize re-use of software and hardware components. This design was driven by a desire to minimize software licensing costs (such as those for commercial relational databases and operating systems), and maximize hardware utilization. However, this created some undesirable consequences. If a business requirement changed, it would impact a large number of layers and components. The architecture makes it difficult to optimize components for each business, since they are shared. There are also problems caused by a misalignment of ownership between lines of business and projects for creating and maintaining various services and components.
All services and subsystems should subscribe to a central logging facility for debugging and monitoring purposes. This makes information available in a central location for analysis. Modern logging platforms allow for streaming and batch processing of data, and extensive analytics to be performed on log data across data sources.
Correlation IDs are identifiers that are passed between processes, programs, and subsystems in order to trace dependencies in the system. This design pattern is particularly important in microservices architectures where a business activity may be carried out by hundreds of microservices, and other applications, acting in concert. Centralized logs can be searched for specific correlation IDs to debug specific errors, and diagnose overall system behavior.
As mentioned above, using centralized databases to store state information can create a single point of failure in the system. The microservices architecture dictates that context be bounded to each microservice. This means that each microservice is responsible for maintaining its own state. This shifts responsibility from a centralized, shared DBA team to the team delivering the microservices themselves. Bounded contexts reduce coupling between services, making systemic failures less likely.
As mentioned above, one of the main weaknesses of the SOA was difficulty in adapting services to needs that are specific to certain businesses. Adoptees of microservices architectures are attempting to change that by recognizing the importance of domain driven design in best practices. DDD should be used to determine how best to partition services along business lines. In addition, DDD can drive definition of what behavior should be exhibited in the event of subsystem failure or degradation in performance. For instance, if an AML (anti-money laundering) service fails to respond, perhaps a manual approval user interface should be presented to administrators. It is important to keep in mind that failures can be partial, can cascade to other applications and services, and may only show up when a service is interacting with other parts of the system. Resiliency and disaster-recovery requirements cannot come purely from a technical understanding of the system. These requirements must be driven by business requirements from the domain.
Legacy code and systems are often portrayed as the immovable object of IT. Rather than assuming that legacy code cannot be changed or replaced, changes should be prioritized based on business requirements. Legacy programs may have static routing, have inadequate logging, or may have bugs that can put business continuity at risk. If legacy code shows any of these weaknesses, and is a high priority to fix given business considerations, it may be warranted to migrate them to a new architecture or fix the bugs in the current program.
This is a technical whitepaper I authored while at Ubicom. In addition to authoring the paper, I designed the benchmark, ran the tests, and did graphic design and layout for the paper. Tools used were Ixia IxChariot, MS Excel, MS Word, and other tools.
OPScore Whitepaper

Are you learning about Agile software methods, but aren’t sure how to apply them to global software? This article explains how to do globalization in an organization using Scrum as a methodology.
The primary activities of software globalization are internationalization, localization, and testing. We will describe how each activity maps to the Scrum process.
Software internationalization is the process of architecting and writing software so it will function properly in multiple countries. It involves designing software in a modular fashion so new countries can be easily supported by swapping out language packs and software libraries, rather than rewriting lots of code. This is a primary engineering task, and is well-suited to being done with Scrum. Requirements from international customers tend to change rapidly, so using Scrum to address these requirements in an agile fashion is a great idea.
This is functional testing that is specific to the internationalization process. This verifies that generic features can be used by international customers, and also verifies features that are specific to certain international market segments.

This is a diagram describing the software globalization process. This was developed for Aeontera, Inc. Developed in Adobe InDesign CS4. Click to download a PDF version.
Video promoting Ubicom’s QoS technology for streaming media over a wireless network. I produced this using Adobe Premier, Photoshop, and Cubase SX3. It even includes an original music track!

Data on 3G subscribers is from Mary Meeker’s ‘Internet Trends 2010’ presentation from Morgan Stanley. Created using Tableau Public visualization software.
What can we learn from these charts? First, let’s look at ARPU growth. It seems there is fairly broad pressure on ARPU across the board. The big players, however, are holding their own around 0% change in ARPU YoY. The highest ARPU is concentrated among US and European service providers. Note that AT&T’s wireline business is listed separately from the wireless business. The greatest drop in ARPU last year was felt by the smaller regional players in Asia and India.
Now let’s look at market cap for service providers versus blended ARPU and number of subscribers. It is interesting to see that firms with the highest market cap are placed along a line that maximizes either ARPU or number of subscribers. The small players in the previous chart likewise show up with low market cap, ARPU, and subscribers. They clearly have a long way to go to reach the profitable horizon of the big players.